

Descriptive statistics summarize and describe data, while inferential statistics make predictions or inferences about populations based on sample data.
TL;DR Descriptive statistics Vs. Inferential statistics
Descriptive statistics provide researchers with valuable insights into the characteristics of their data. By calculating measures such as central tendency (mean, median, mode) and dispersion (range, standard deviation), researchers can gain a better understanding of the distribution and variability within their dataset. This information is useful for providing an overview of the data or identifying any patterns or trends that may exist.
Inferential statistics enable researchers to make inferences about an entire population based on findings from a smaller sample size. Through techniques like hypothesis testing and confidence intervals, researchers can estimate parameters of interest and determine whether relationships identified in the sample are statistically significant.
Descriptive statistics
Descriptive statistics involves methods for summarizing and presenting data in a meaningful and understandable way. Its primary purpose is to describe and depict the main features of a dataset, providing insights into the underlying patterns, trends, and characteristics.
Common measures of central tendency, like the mean, median, and mode, offer a sense of the dataset’s central value. Measures of dispersion, such as range, variance, and standard deviation, convey the spread or variability within the data.
Graphical representations, including histograms, box plots, and scatter plots, visually illustrate the distribution and relationships among variables. Descriptive statistics help researchers and analysts comprehend the dataset’s structure, identify outliers, and communicate key findings to a broader audience.
This statistical approach is foundational in fields like economics, sociology, and epidemiology, aiding researchers in the exploration and initial understanding of data before delving into more complex analyses.
Descriptive statistics alone do not draw conclusions about broader populations; instead, they provide a snapshot of the observed data, serving as a crucial preliminary step in the statistical analysis process.
Inferential statistics
Inferential statistics involves drawing conclusions or making inferences about populations based on sample data. It goes beyond merely describing the observed data, aiming to generalize findings and assess the likelihood of those findings occurring in a larger context.
Statistical inference utilizes probability theory to estimate parameters, test hypotheses, and make predictions about a population.
Key tools in inferential statistics include hypothesis testing, where researchers evaluate assumptions about population parameters using sample data, and confidence intervals, which provide a range within which a population parameter is likely to fall.
Regression analysis examines relationships between variables, predicting the impact of one variable on another.
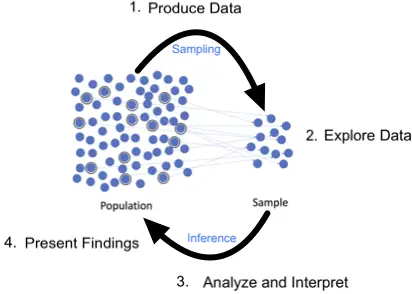
Sampling methods are crucial in inferential statistics to ensure that the sample is representative of the population. The goal is to minimize sampling error and increase the reliability of the inferences made.
Inferential statistics is widely employed in scientific research, business analytics, and decision-making, allowing researchers and analysts to make informed predictions and generalizations beyond the specific data collected.
Descriptive statistics Vs. Inferential statistics – Key differences
| Aspect | Descriptive Statistics | Inferential Statistics |
|---|---|---|
| Purpose | Summarizes and describes data. | Draws conclusions or inferences about populations based on sample data. |
| Data Presentation | Presents data in a meaningful and understandable way. | Uses probability theory to estimate parameters, test hypotheses, and make predictions. |
| Focus | Describes the main features of a dataset. | Generalizes findings to a larger population. |
| Measures Used | Central tendency (mean, median, mode), dispersion (range, variance, standard deviation). | Hypothesis testing, confidence intervals, regression analysis. |
| Application | Initial exploration and understanding of data. | Decision-making, predictions, hypothesis testing in scientific research and analytics. |
| Examples | Mean income, median age, standard deviation of test scores. | Confidence interval for a population mean, hypothesis test comparing two groups. |
| Sampling | Not dependent on sampling methods; summarizes observed data. | Relies on representative sampling to ensure generalizability to the population. |
| Goal | Provides insights into the dataset's structure and characteristics. | Makes predictions or assessments about a broader population based on sample data. |
Purpose of descriptive statistics in research
The purpose of descriptive statistics in research is to summarize, organize, and present key features of a dataset. These statistical methods provide researchers with a clear and concise overview of the data, facilitating a deeper understanding of its characteristics. The main purposes of descriptive statistics in research include:
Data Summarization:
- Descriptive statistics condense large amounts of data into manageable and interpretable forms, such as measures of central tendency (mean, median, mode) and measures of dispersion (range, variance, standard deviation).
Data Exploration:
- Researchers use descriptive statistics to explore patterns, trends, and distributions within the data, helping to identify outliers, patterns, and potential relationships between variables.
Data Communication:
- Descriptive statistics provide a basis for clear and effective communication of research findings to both academic and non-academic audiences. Graphical representations, such as charts and graphs, enhance visual communication.
Data Comparison:
- Researchers can compare different groups or conditions within the dataset using descriptive statistics. This aids in highlighting similarities, differences, and important trends.
Initial Understanding:
- Before conducting more advanced analyses, descriptive statistics offer an initial understanding of the data, guiding researchers in formulating hypotheses and determining the appropriate statistical methods for further investigation.
Descriptive statistics serve as a foundational step in the research process, helping researchers gain insights, communicate findings, and make informed decisions before moving on to more advanced statistical analyses.
Importance of inferential statistics in research
Inferential statistics play a crucial role in research by enabling researchers to draw conclusions, make predictions, and generalize findings beyond the specific sample studied. The importance of inferential statistics in research includes:
Generalization:
- Inferential statistics allow researchers to make inferences about entire populations based on sample data. This is vital for applying research findings to broader contexts.
Hypothesis Testing:
- Researchers use inferential statistics to test hypotheses and make informed decisions about the validity of assumptions or claims regarding population parameters.
Prediction:
- Inferential statistics enable researchers to make predictions about future outcomes or behaviors based on the observed relationships within the sample.
Parameter Estimation:
- Researchers can estimate population parameters, such as means, variances, or proportions, with a degree of confidence using inferential statistics.
Comparisons and Relationships:
- Inferential statistics facilitate the comparison of groups and the examination of relationships between variables, helping researchers identify patterns and draw meaningful conclusions.
Image Credits
Featured Image By – Gerd Altmann from Pixabay
Image 1 By – Loneshieling, CC BY-SA 4.0, via Wikimedia Commons