Variance gives us an idea about how spread out our data is from the mean, while standard deviation tells us how much each value differs from the average. Standard deviation is often more intuitive as it uses units that are familiar to us, such as dollars or years.
Definition of Standard Deviation
Standard deviation is a statistical measure that helps to describe the amount of variation or dispersion in a given set of data. It tells us how far from the mean each data point is and gives an idea about the spread of data around the central tendency.
In other words, standard deviation measures how much individual observations differ from their average value. If the standard deviation is low, it means that most values are close to the mean; if it’s high, then there’s a wide range of values.
Standard deviation is usually expressed in the same units as those used for measuring data points. For example, if your dataset consists of heights measured in centimeters, then your standard deviation will be expressed in centimeters too.
Calculating standard deviation can help you identify outliers more efficiently since they fall outside two or three times its value from either side of the mean. This information can be useful when analyzing datasets with extreme values that could skew results if included without proper consideration.
Definition of Variance
Variance is a statistical measure that calculates the spread of data points in a dataset. It determines how far each value in a set is from the mean or average value. In simple terms, variance measures how much the data deviates from its expected value.
To calculate variance, you first need to find the mean of the dataset by adding all values and dividing by the total count. Then for each value, you subtract the mean and square it. You add up these squared differences and divide by n-1 (where n is the number of data points). This gives you your variance.
A high variance indicates that there are significant differences between individual values and their average, while a low variance means that most values are clustered around their average. Variance can also be used to analyze trends over time or compare datasets with different scales.
Understanding what variance is and how it’s calculated helps us get valuable insights into our data sets. By analyzing this measure along with other statistical tools like standard deviation, we can gain deeper insights into our data’s characteristics and make more informed decisions based on them.
Standard Deviation Vs. Variance – Key differences
(Photo by Pritesh Sudra on Unsplash )

Standard deviation and variance are two measures of dispersion that are commonly used in statistics. While both of these terms may seem similar, they differ in their calculation method and interpretation.
Variance is a measure of how spread out a set of data is from its mean value. It involves calculating the difference between each data point and the mean, squaring those differences, adding them together, and then dividing by the number of observations.
On the other hand, standard deviation measures how much variation there is from the average or mean value. It represents the square root of variance and has the same unit as the original dataset.
One key difference between standard deviation vs. variance is that while both give an indication about the amount of variability within a set of data points, variance gives larger weight to extreme values than standard deviation does. This means that if there are any outliers in your dataset with large deviations from their respective means; it will inflate the calculated value for variance more than it would for standard deviation.
Another important distinction between these two statistical metrics is that unlike variance which cannot be negative since it’s always squared (and therefore positive), standard deviation can be either positive or negative depending on whether individual values lie above or below their respective averages.
It’s essential to keep these differences in mind when choosing which statistical metric to use based on your goals and research question at hand.
How to calculate Variance?
Calculating variance is essential in statistical analysis to measure the dispersion or spread of a set of data from its mean value. To calculate variance, you need to follow a straightforward formula.
Firstly, find the mean value of your dataset by adding all the values and dividing them by the total number of items in it. Next, subtract this mean from each item in your dataset and square these differences.
Then add up all squared differences and divide them by one less than the total number of items (n-1). This will give you an unbiased estimate for population variance.
To simplify things further, here’s how you can remember calculating Variance: Find Mean > Subtract Mean from Each Item > Square Differences > Add Squared Differences > Divide Sum By n-1
It’s necessary to understand that variance doesn’t work well with negative numbers, so ensure all values are positive when using this method.
How to calculate Standard Deviation?
(Photo By https://ultrabem.com on Flickr)

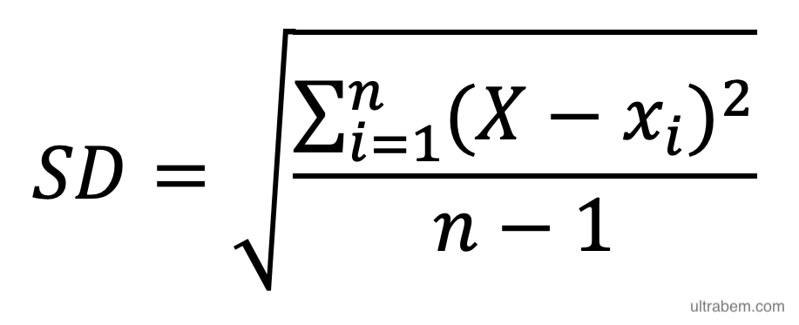
Calculating the Standard Deviation is an essential step in understanding and analyzing data. The process involves finding the average distance between each data point and the mean of a given dataset. Here’s how to calculate it:
- Find the Mean – Add up all of your values, then divide by the number of data points.
- Calculate Differences – Subtract each value from the Mean.
- Square Each Difference – Take each difference obtained in step 2, square them individually, then add them together.
- Divide by n-1 – Divide this sum by one less than the total number of data points (n-1).
- Take Square Root – Take the square root of this result.
Remember that if your sample size is large enough (>30), you can use a simplified formula to calculate Standard Deviation directly without going through these steps!
When to use Standard Deviation Vs. Variance?
When it comes to analyzing data, both Standard Deviation and Variance are important measures that can provide useful insights. However, they are not interchangeable and should be used in different contexts.
Standard Deviation is typically used when you want to measure the amount of variation or spread in a dataset. It tells you how much each data point deviates from the mean of the entire set. This information can be helpful for identifying outliers or determining if your sample accurately represents the population.
On the other hand, Variance is often used when you want to compare two or more datasets and determine which one has less variation overall. It’s also important in statistical modeling as it helps estimate parameters like regression coefficients.
In general, Standard Deviation is easier to interpret since its units match those of your original data while Variance has squared units. However, both measures have their place depending on what question you’re trying to answer with your analysis.
Ultimately, whether you choose to use Standard Deviation or Variance depends on what type of research question you’re trying to answer and what kind of insights would be most helpful for informing decisions based on that research.
What is an example of a variance?
One example of a variance is when calculating the grades of students in a class. Let’s say there are 10 students in a math class, and their grades are as follows:
Student 1: 90
Student 2: 85
Student 3: 92
Student 4:78
Student 5:70
Student6 :65
Student7 :82
Student8 :88
Student9 :80
Student10 :95
To calculate the variance, we first need to find the mean or average grade. In this case, it would be (90+85+92+78+70+65+82+88 +80 +95)/10 =81.5.
Next, we subtract each grade from the mean and square it:
(90 -81.5)^2 =67.22
(85 -81.5)^2=12.25
(92 -81.5)^2=108.62
…
(95 – 81 .5) ^2 =189
We then add up all these squared differences and divide by the total number of grades (in this case, n=10):
Total Variance :
[(67 .22 +12 .25 +108 .62…189 )/10] ≈277In conclusion , This means that on average, each student’s grade deviates from the mean by about √27 points²
What is an example of a Standard Deviation?
An example of standard deviation is important to understand how it works in real-life situations. Let’s say you are a teacher and want to measure the performance of your students on a math test. You have three classes with 30 students each, so a total of 90 students took the test.
Class A had an average score of 70%, Class B had an average score of 80%, and Class C had an average score of 85%. At first glance, it seems like Class C performed the best overall. However, we need to calculate the standard deviation for each class to see if there is any variation within each group.
After calculating the standard deviation for each class, we find that Class A has a standard deviation of 10%, Class B has a standard deviation of 5%, and Class C has a standard deviation of only 2%. This means that while all three classes had different averages, they also varied differently in their individual student scores.
The smaller the standard deviation, the more consistent or homogeneous are data points – meaning that there is less dispersion around its mean. In this case, even though Classes B and C both scored higher than Class A on average, it’s clear that those two classes have less variability among their students’ grades compared to class A.
Featured Image By – Chad Miller on Flickr


