
A dashboard offers real-time visual insights, while a report provides a structured summary of past data and analysis.
TL;DR Dashboard Vs. Report
Dashboards are dynamic visualizations that offer real-time information in a concise and easy-to-understand manner. They allow users to monitor key metrics at a glance, providing an overview of the current state of affairs.
Reports provide comprehensive and detailed information on specific aspects of business performance. They are often more static in nature and follow a predefined structure or format.
What is a dashboard?
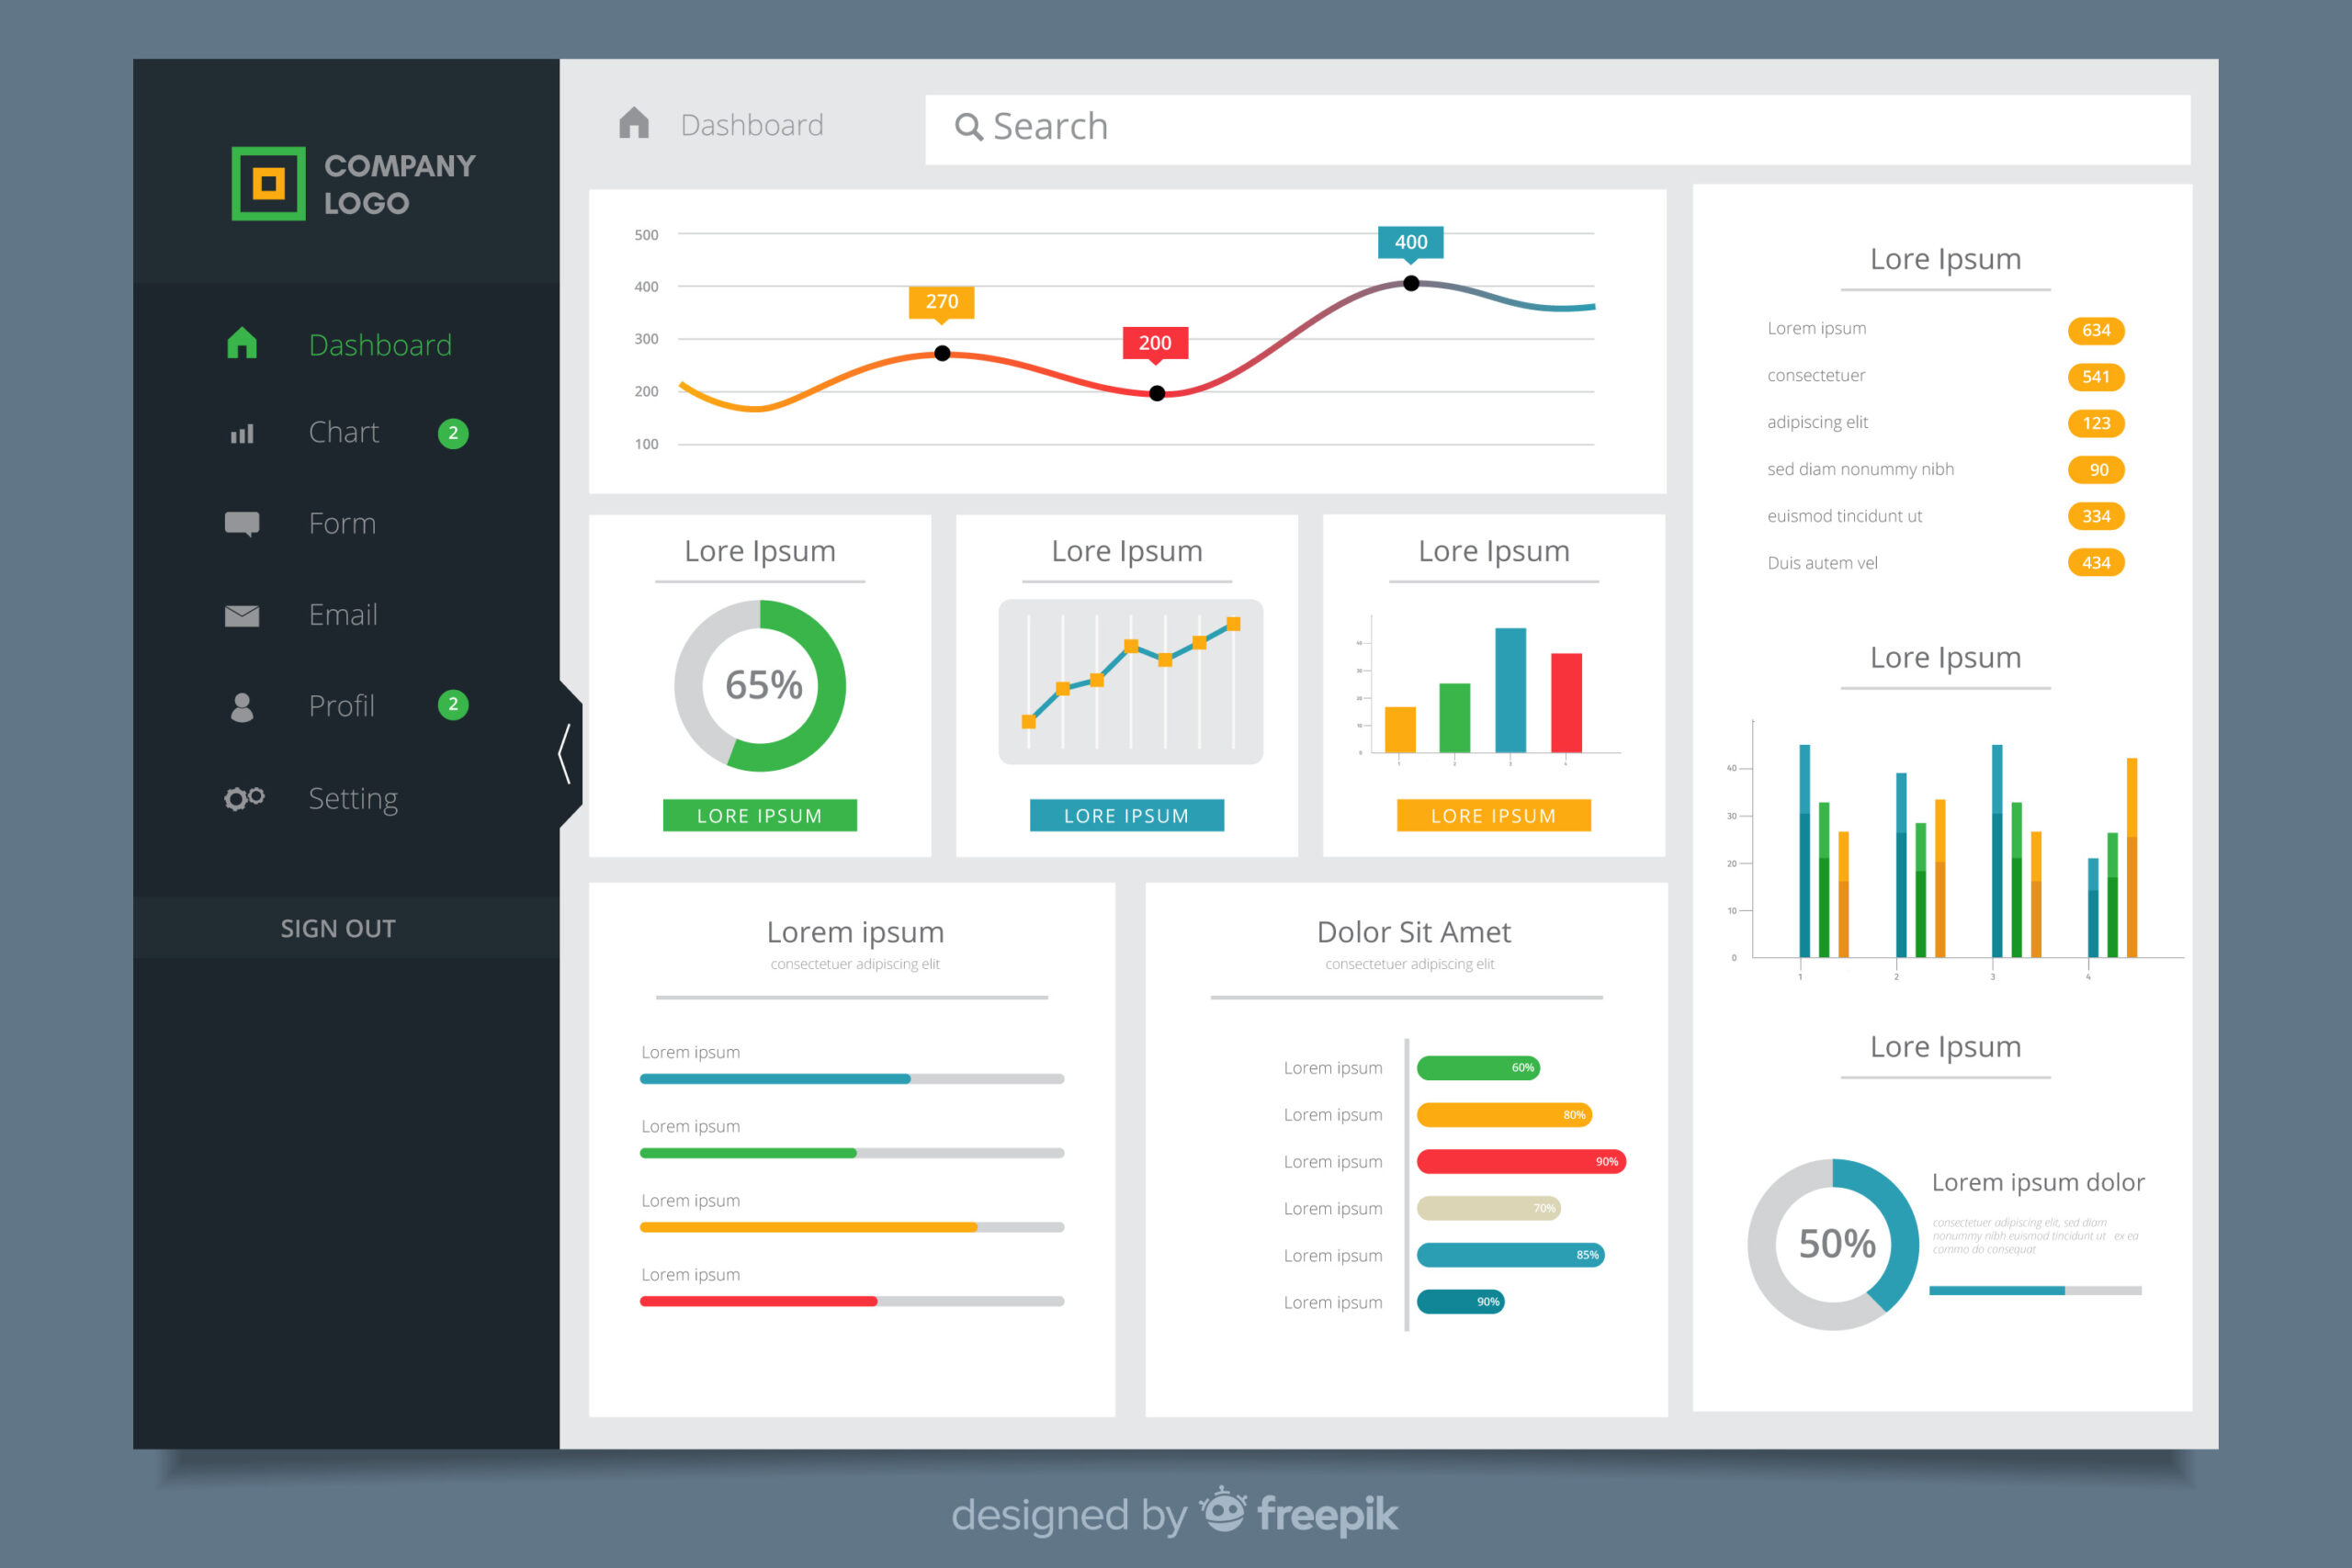
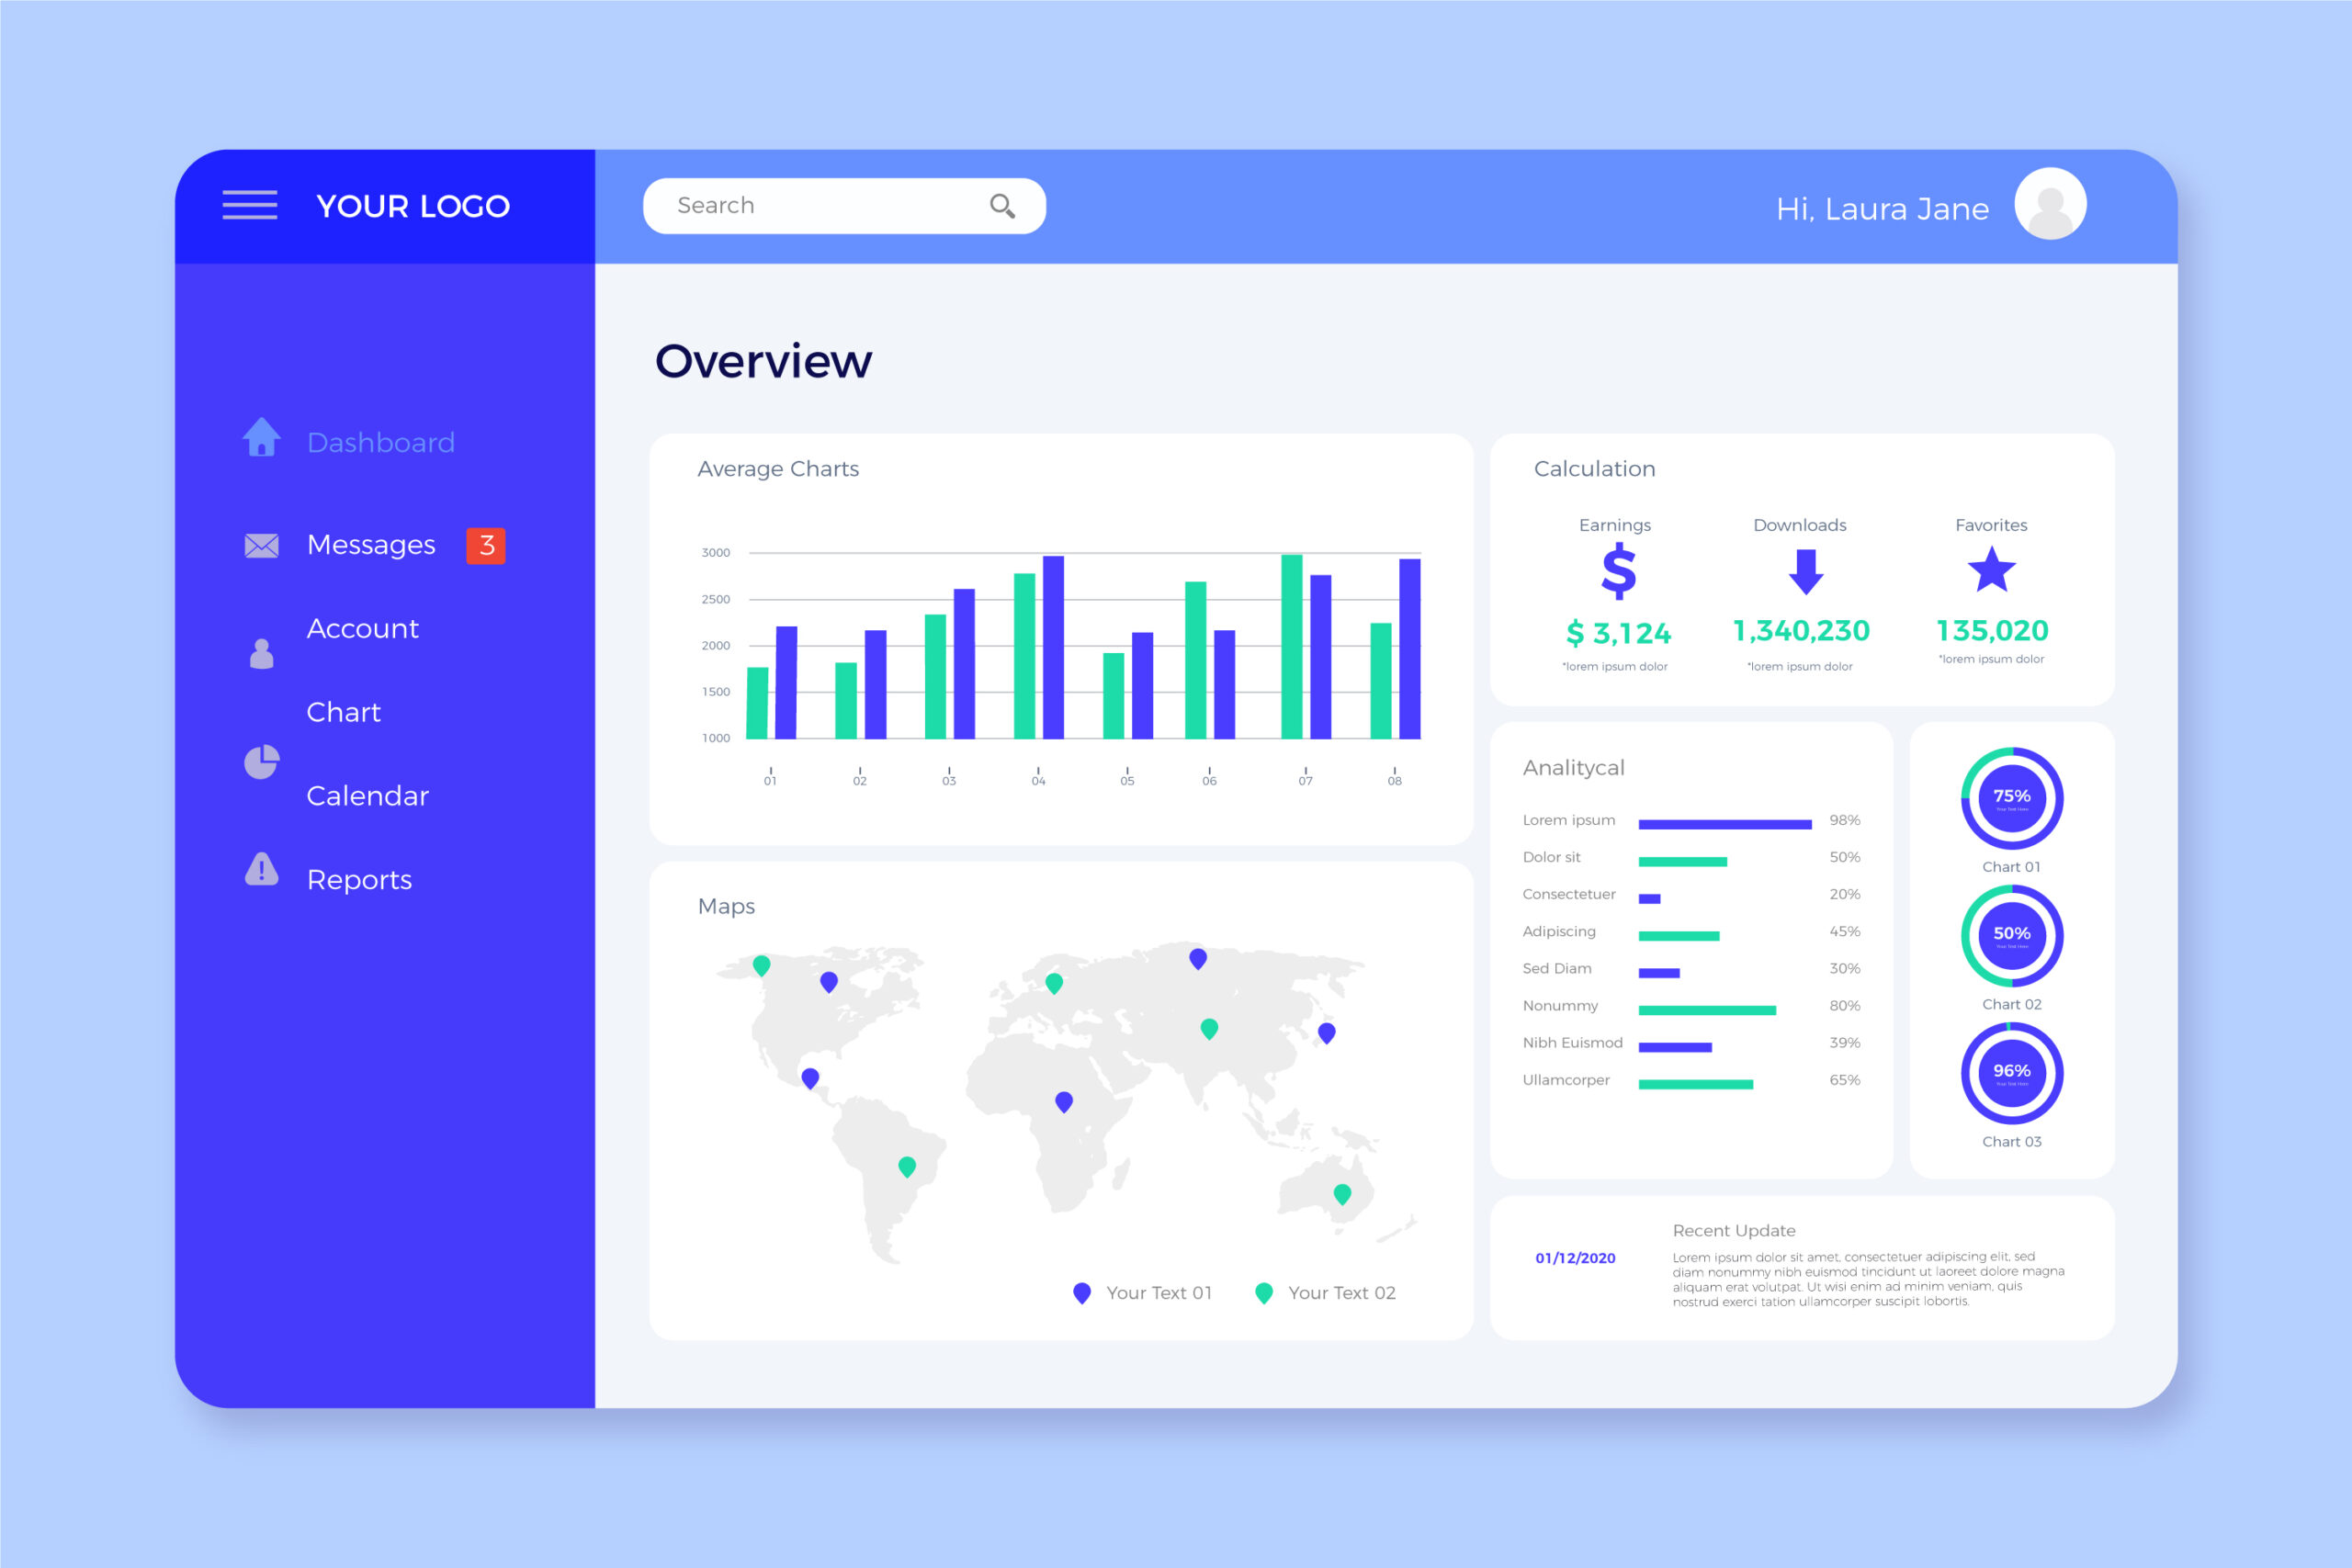
A dashboard is like the control center of your data universe. It’s a visual representation that provides an at-a-glance overview of key performance indicators (KPIs), metrics, and other important information.
Dashboards typically consist of various widgets or modules, displaying data in the form of charts, graphs, tables, or even maps. These elements are highly customizable and can be tailored to fit specific needs or preferences.
What is a report?

A report is a document that provides information and analysis on a specific topic or subject. It is typically structured with an introduction, body paragraphs, and a conclusion.
Reports are often used to present data, findings, recommendations, or summaries of events.
Reports contain objective information presented in an organized manner. They include tables, charts, graphs, and other visual aids to help convey complex information effectively.
Dashboard Vs. Report – Key differences
| Aspect | Dashboard | Report |
|---|---|---|
| Purpose | Visualize data at a glance, provide insights | Present structured information and analysis |
| Format | Interactive, visual, often real-time | Static, text-heavy, data tables and charts |
| Focus | Key performance indicators (KPIs) | Detailed data, trends, analysis |
| Interactivity | Allows user interaction, filtering | Limited or no interactivity |
| Presentation | Condenses data into widgets or visuals | Organizes information in a structured format |
| Real-time Data | Often displays real-time or near-real-time | Based on historical or specific timeframe |
| User Audience | Quick decision-makers, executives | Managers, stakeholders, analysts |
| Contextual | Provides a broad overview | Presents specific insights and findings |
| Visualization | Charts, graphs, gauges, heatmaps, etc. | Tables, charts, graphs, textual content |
When to use a Dashboard Vs. A report?
Use a Dashboard When
- Real-time Monitoring: If you need to track real-time or near-real-time data and key metrics, a dashboard is more suitable. It provides a dynamic view of changing data.
- Quick Insights: Dashboards are ideal for quickly visualizing trends, patterns, and KPIs. They allow decision-makers to get a snapshot of the current situation at a glance.
- Interactive Exploration: When users need to interact with data, filter information, or explore different scenarios, dashboards with interactive elements are effective.
- Executive Summaries: Dashboards are often used for high-level summaries, giving executives a quick overview of key metrics and performance.
- Visual Impact: If you want to convey data visually through charts, graphs, and other visual elements, a dashboard can present this information in an engaging way.
Use a Report When:
- Detailed Analysis: For in-depth analysis, reports are better suited. They allow you to present complex data, trends, and insights in a structured manner.
- Comprehensive Information: Reports are ideal for presenting a complete picture of data, providing explanations, context, and detailed findings.
- Static Presentation: If you need to deliver information that won’t change frequently, reports are better. They offer a static, printable format suitable for formal presentations.
- Structured Communication: When you want to present data in a specific order or narrative, reports allow you to present findings logically and coherently.
- Stakeholder Distribution: Reports are often used for sharing information with a wider audience, such as stakeholders, regulators, or internal teams.
Image Credits
Featured Image By – pikisuperstar on Freepik
Image 1 By – pikisuperstar on Freepik
Image 2 By – new7ducks on Freepik